Image Gallery Further images for Chapters 5-10
Image Gallery for North Carolina (NC, USA)
OSGeo Educational data set
Download the free OSGeo Educational data set!
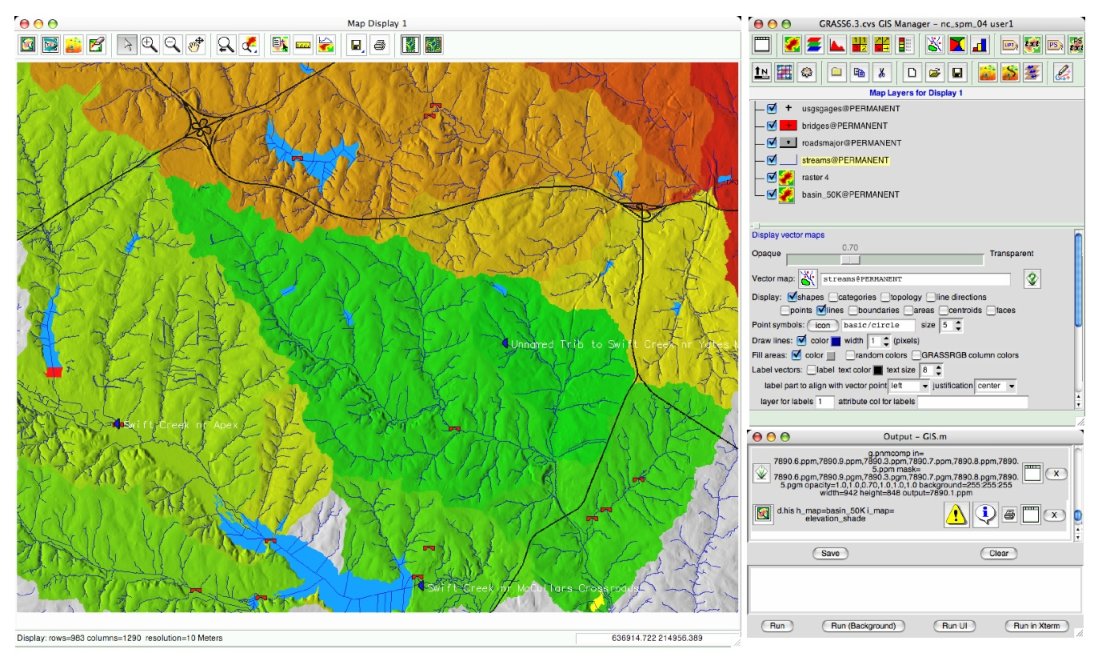 GRASS GIS manager GUI | 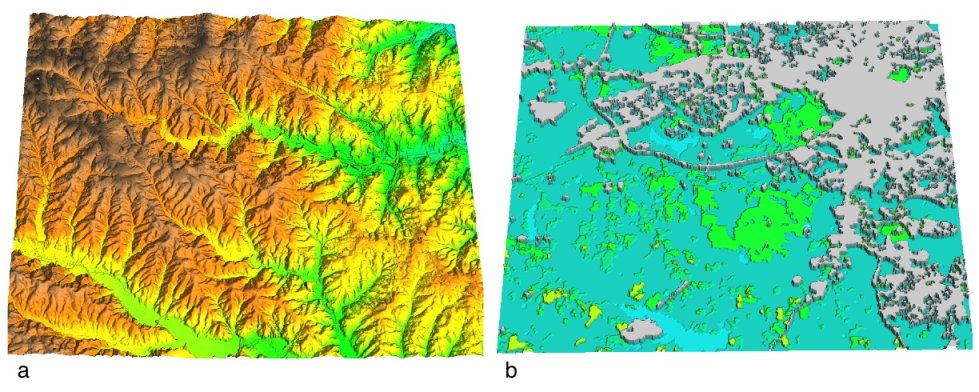 Continuous and discrete raster data |
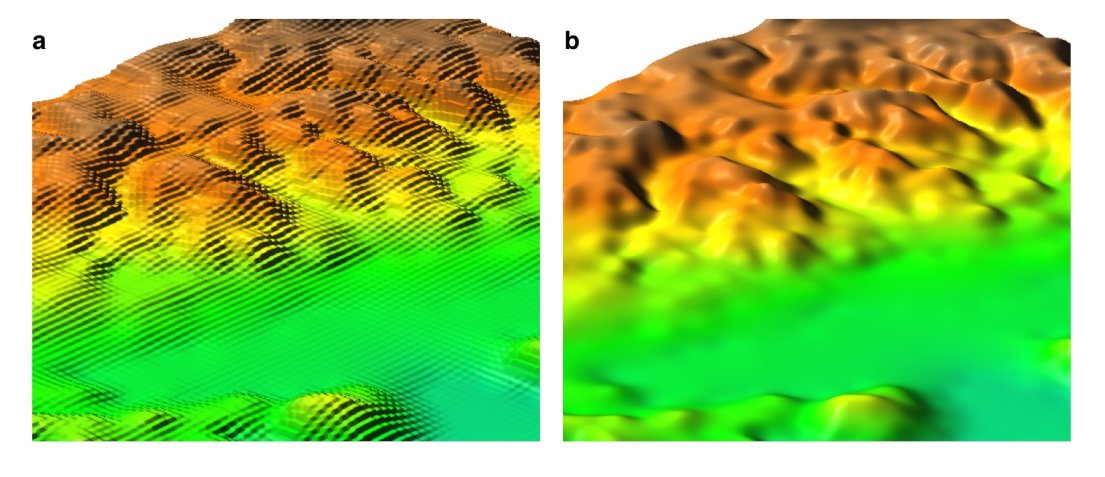 Raster resampling.jpg: nearest neighbor and spline |  Noise impact analysis using buffers |
 Cost surface derived from speed limits map | 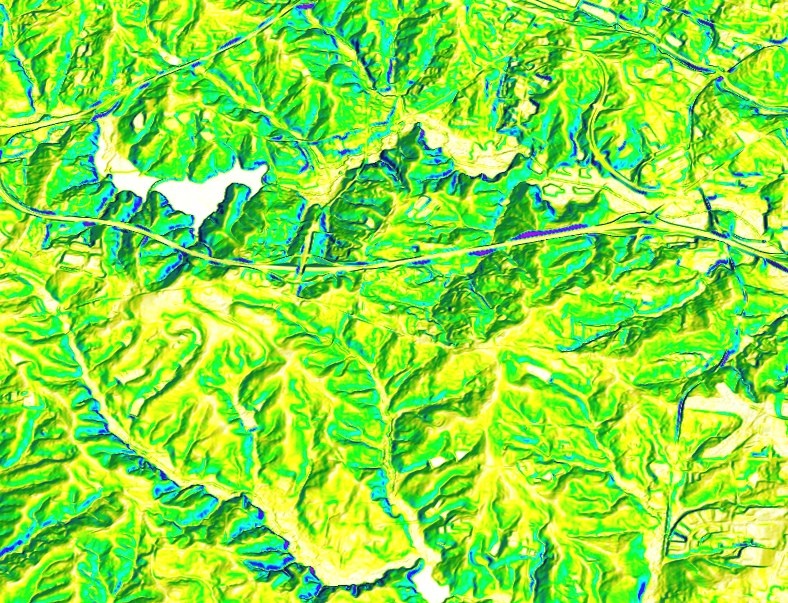 slope derived from DEM |
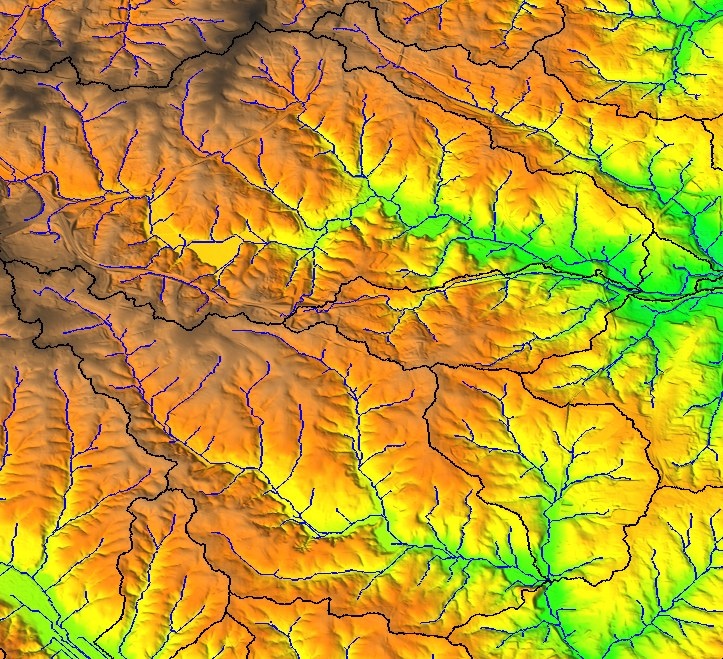 streams and watersheds derived from DEM | 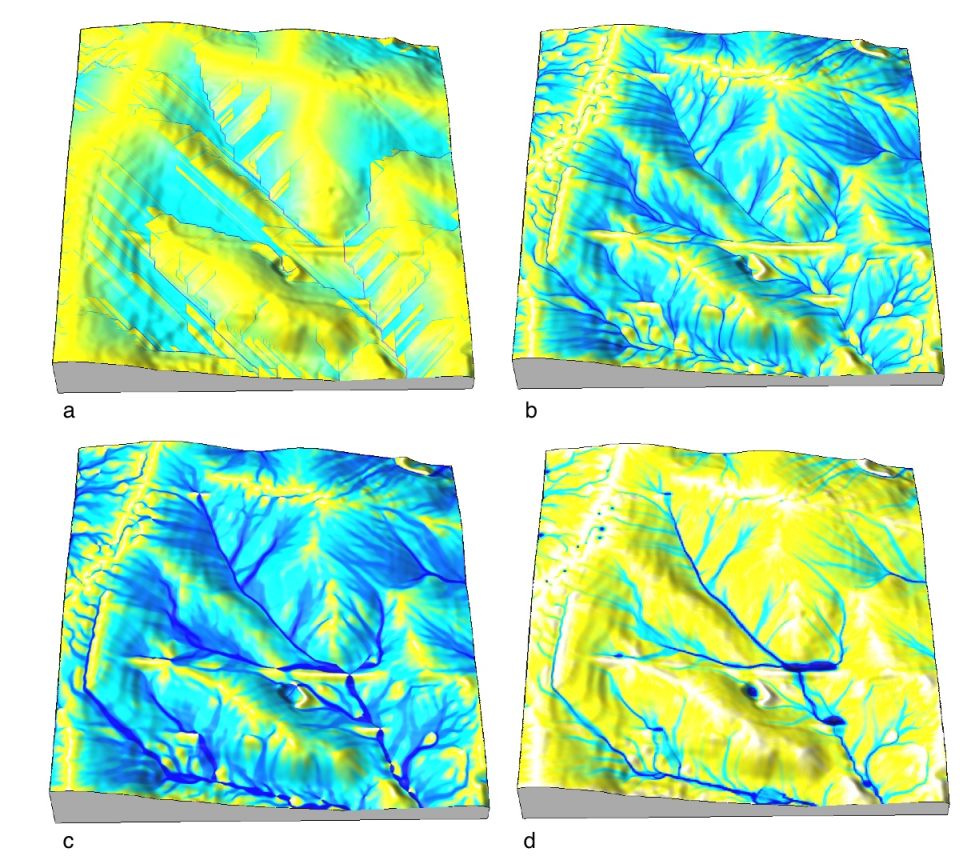 Flowaccumulation using different methods |
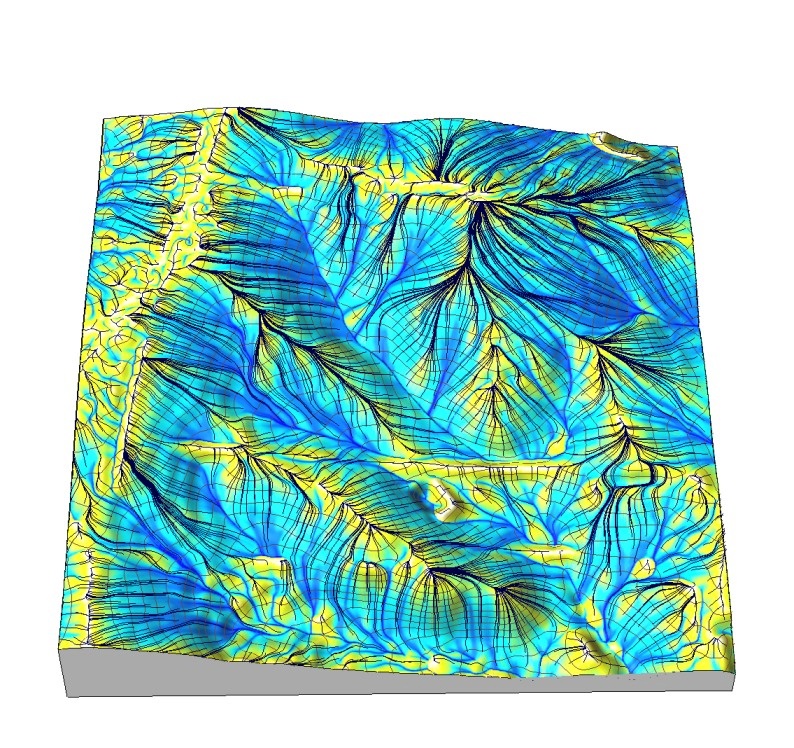 Flowaccumulation and uphill slopelines | 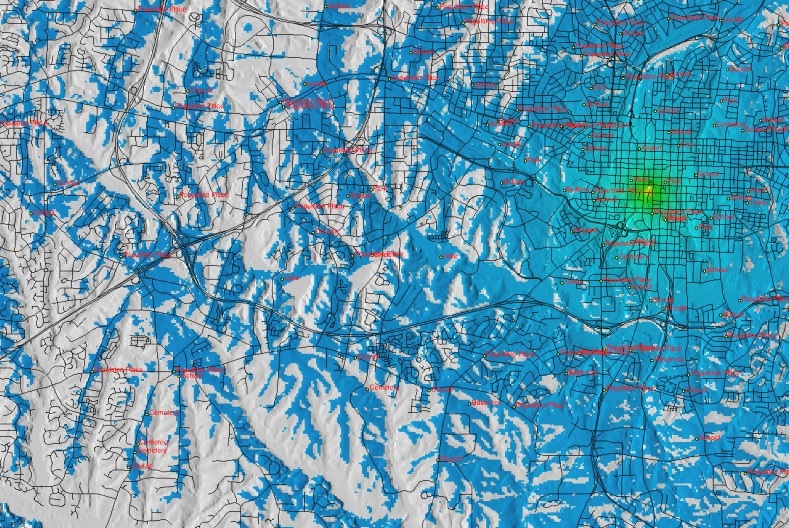 Viewshed analysis RBC tower, Raleigh |
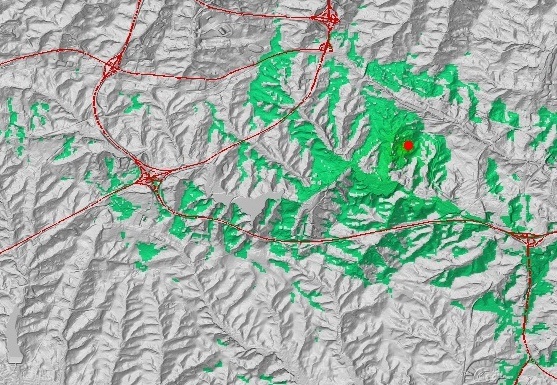 Viewshed analysis RedHat headquarters | 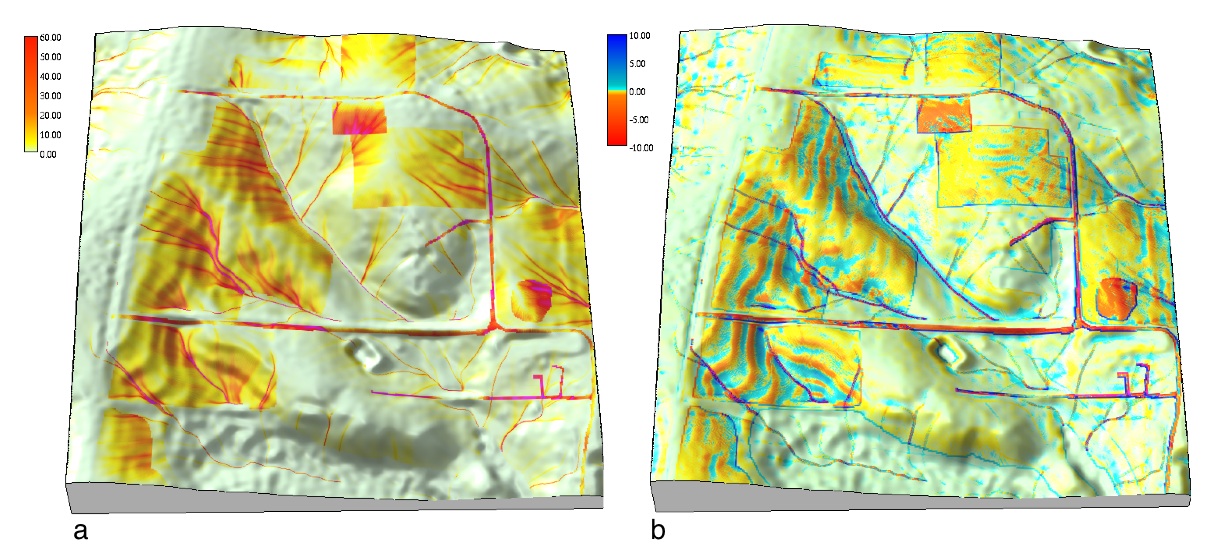 Erosion and deposition modeling |
 Display vector point data using graduated icon size | 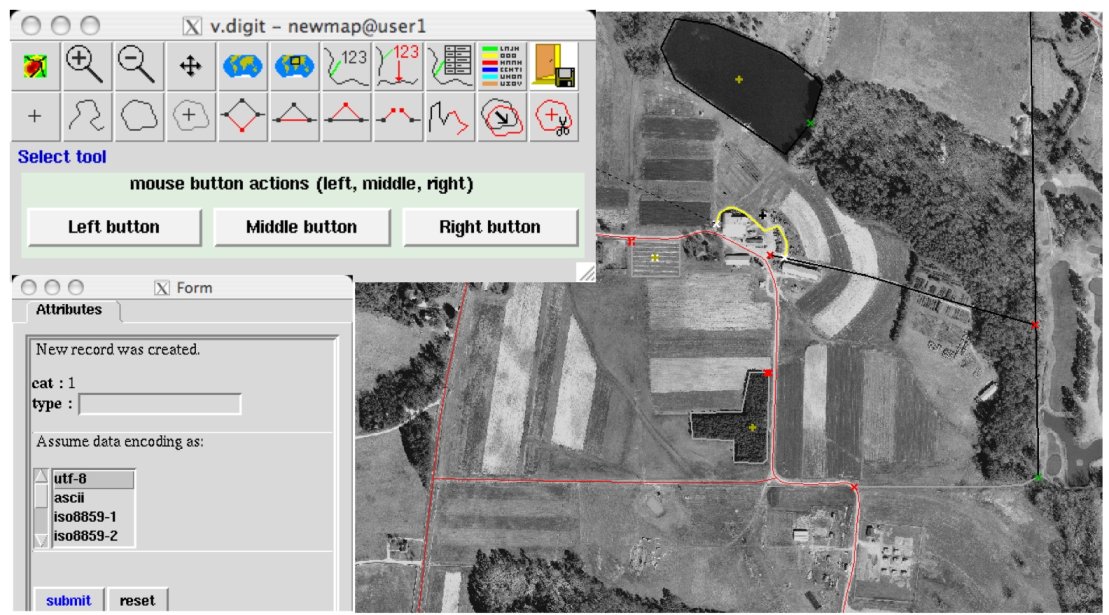 Digitizing with v.digit |
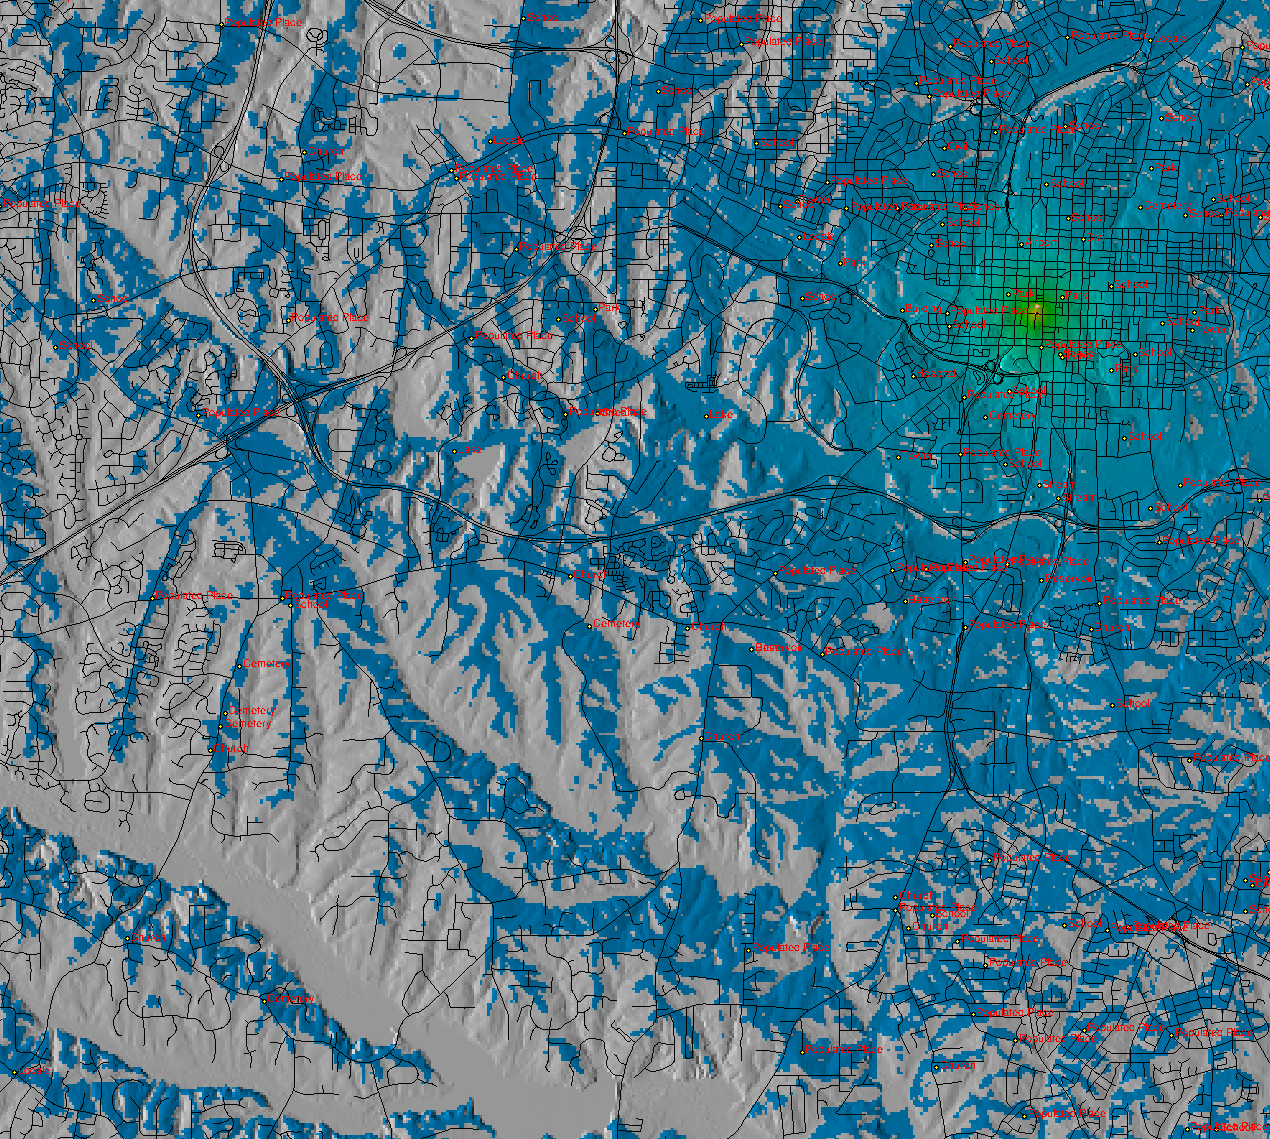 Line of sight analysis with points of interest intersected for visible area (script) | 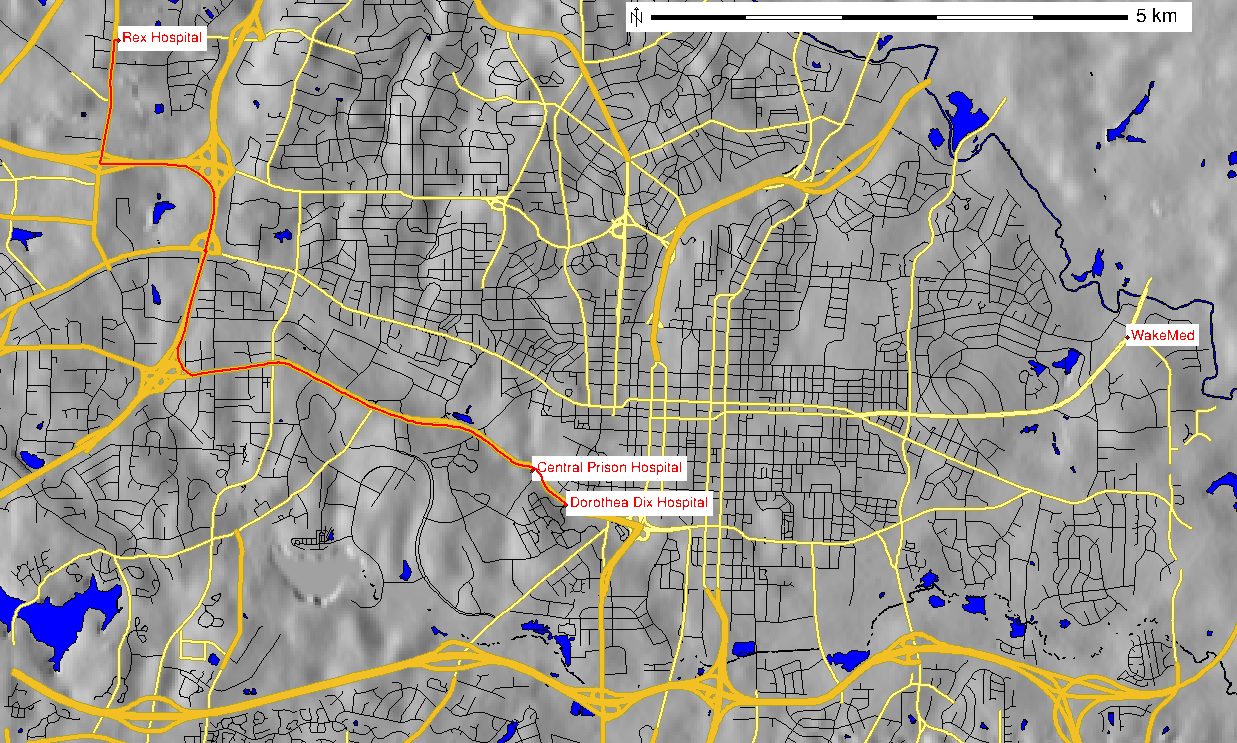 Shortest vector path from Rex to Dixon hospital (script) |
 shortest path between hospitals | 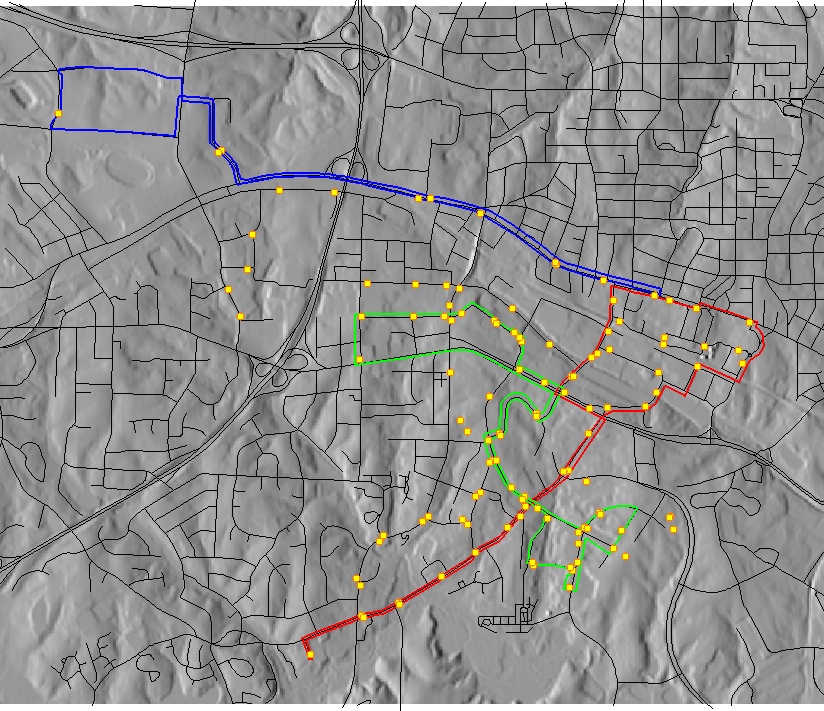 Bus lines and stops |
 Interpolation methods | |
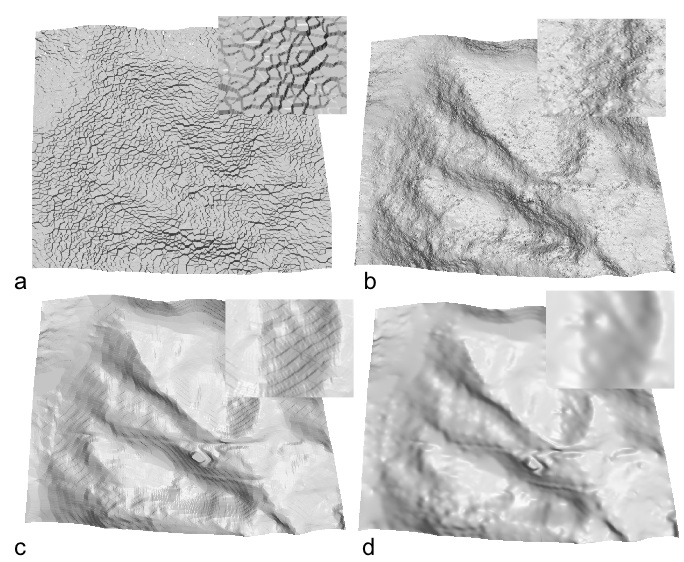
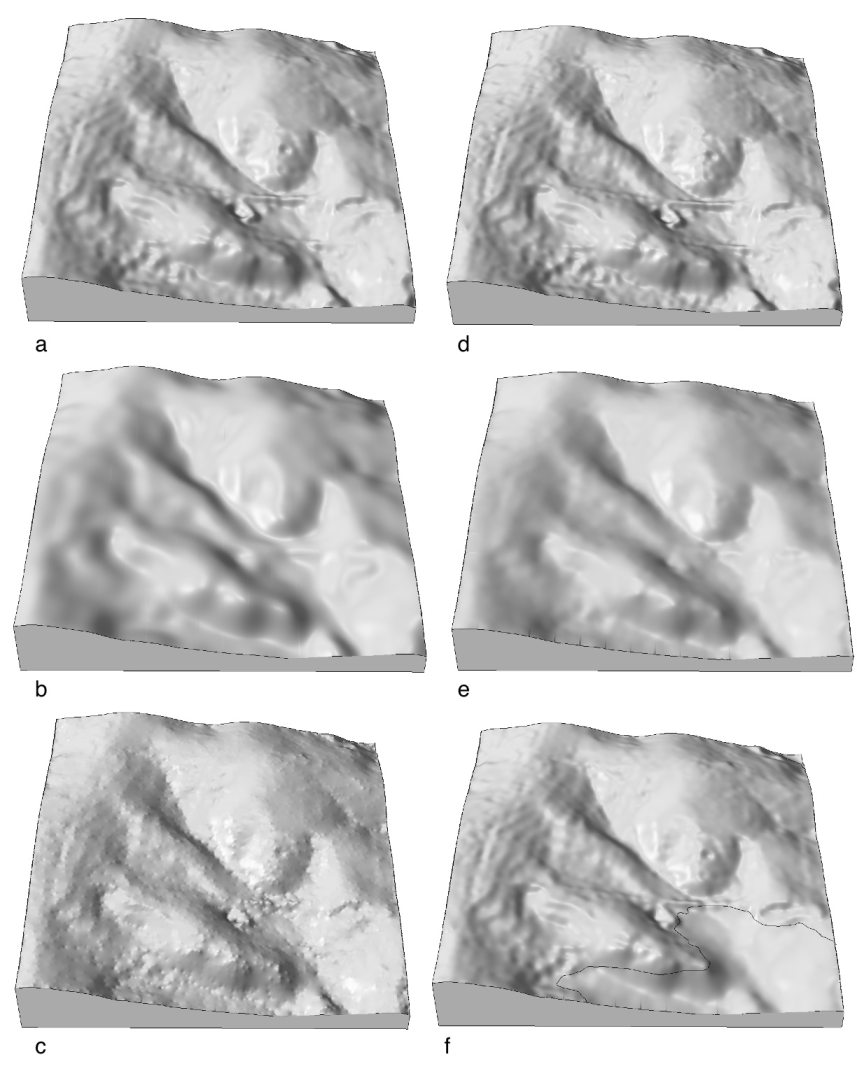 RST interpolation parameters |  Profile curvature from contour data using v.surf.rst |
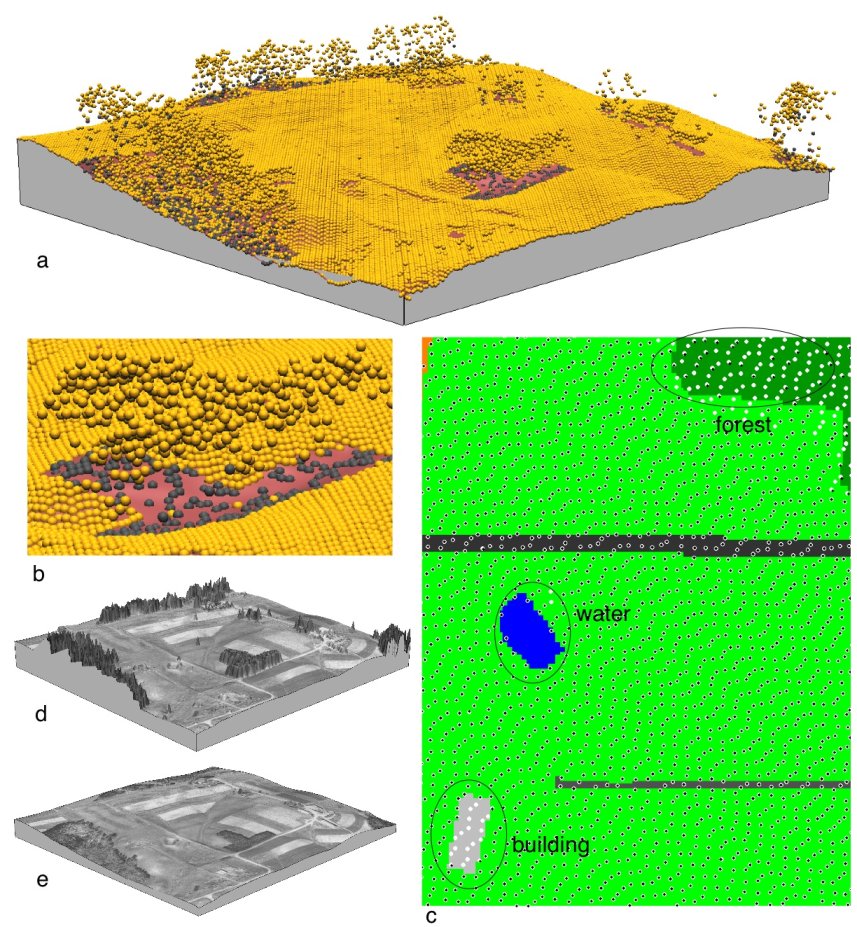 Multiple return lidar data | 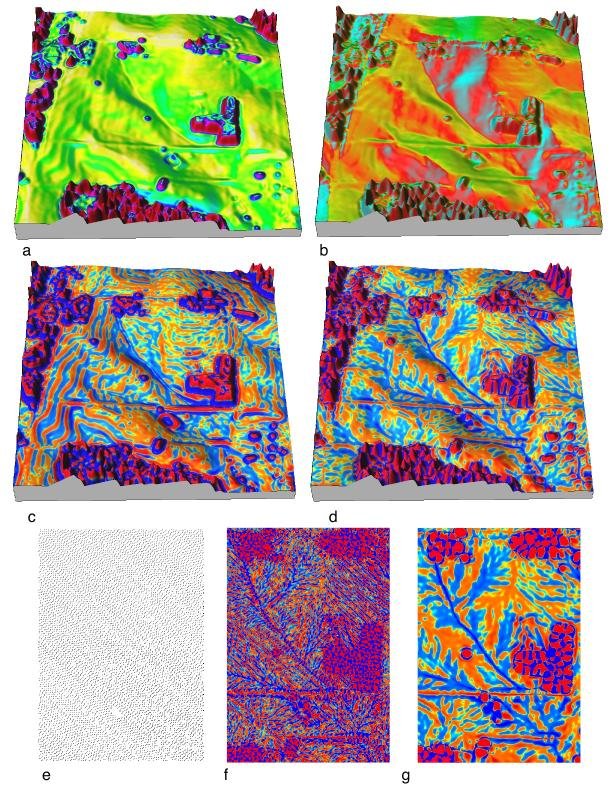 Topographic analysis from lidar data using v.surf.rst |
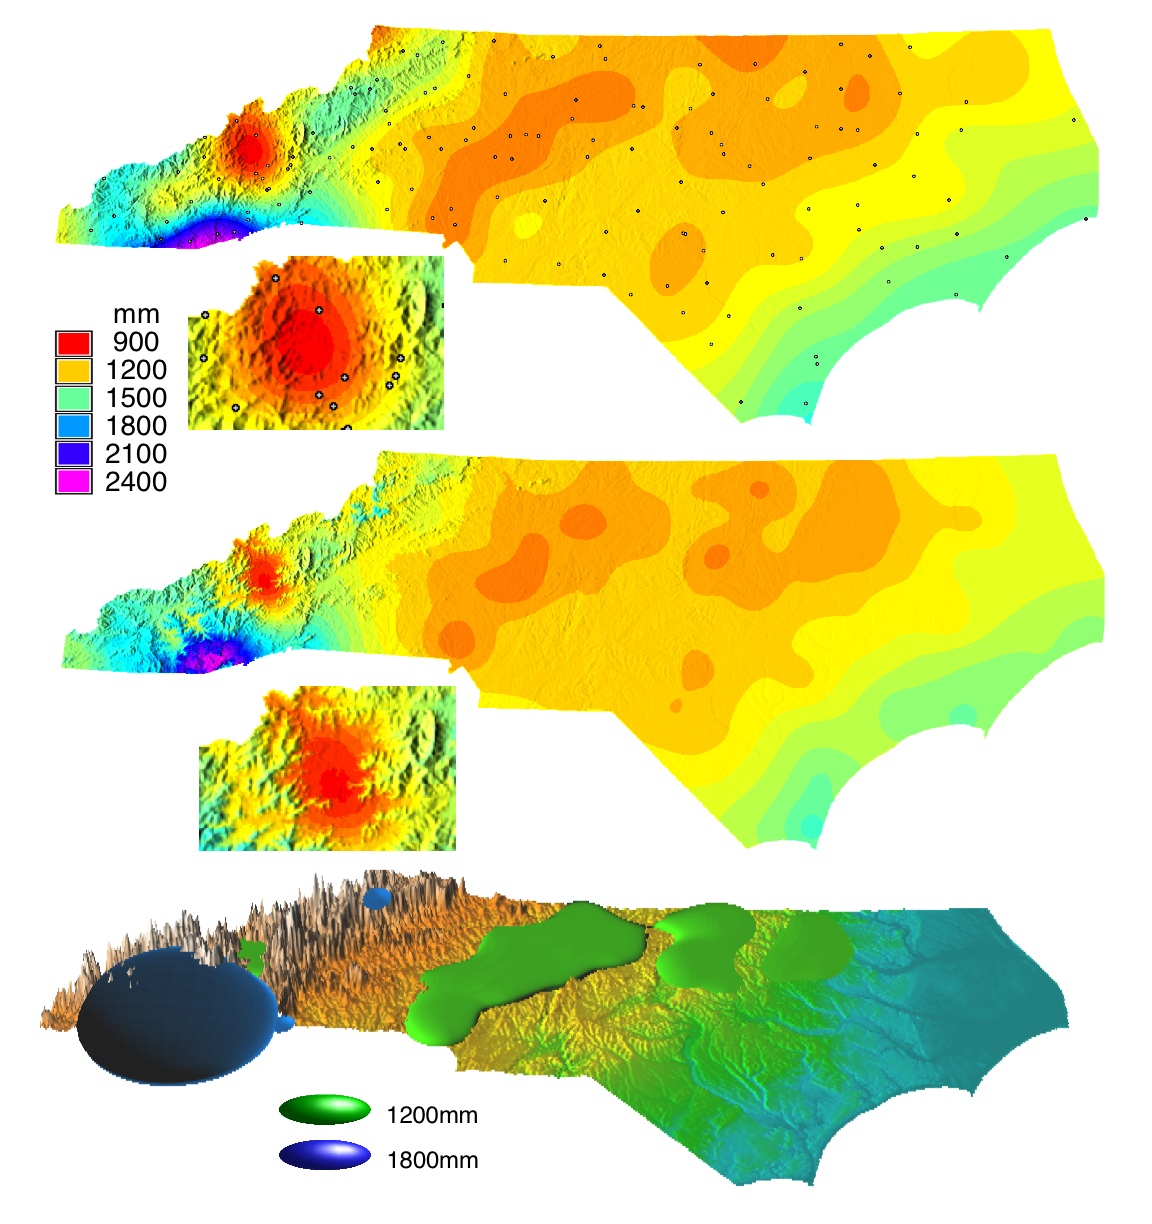 Interpolation of precipitation with influence of topography | 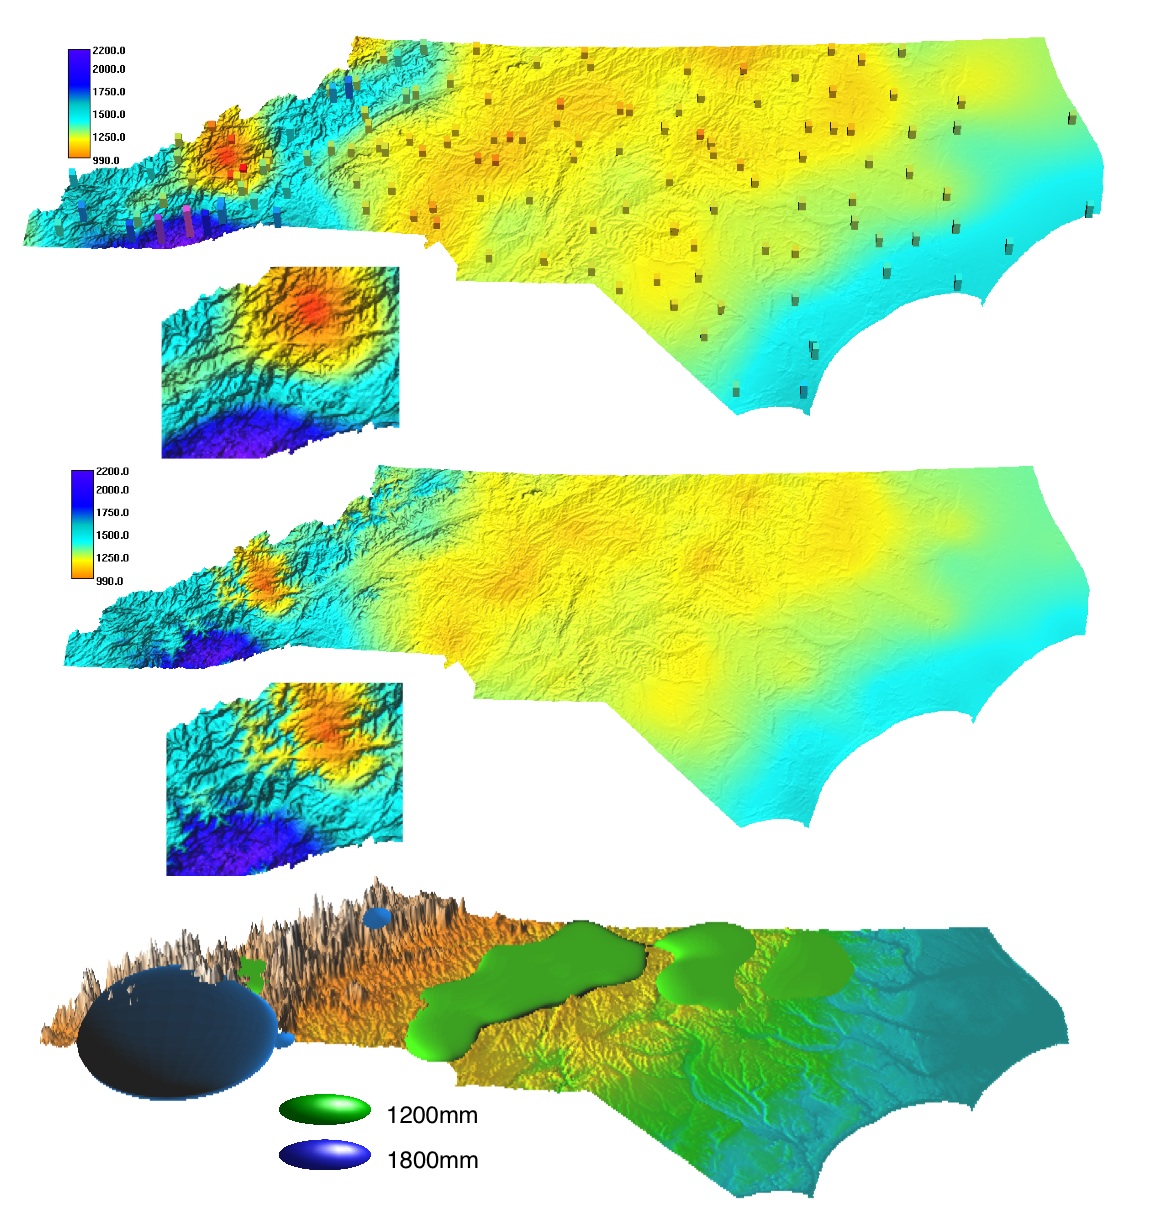 Interpolation of precipitation with influence of topography |
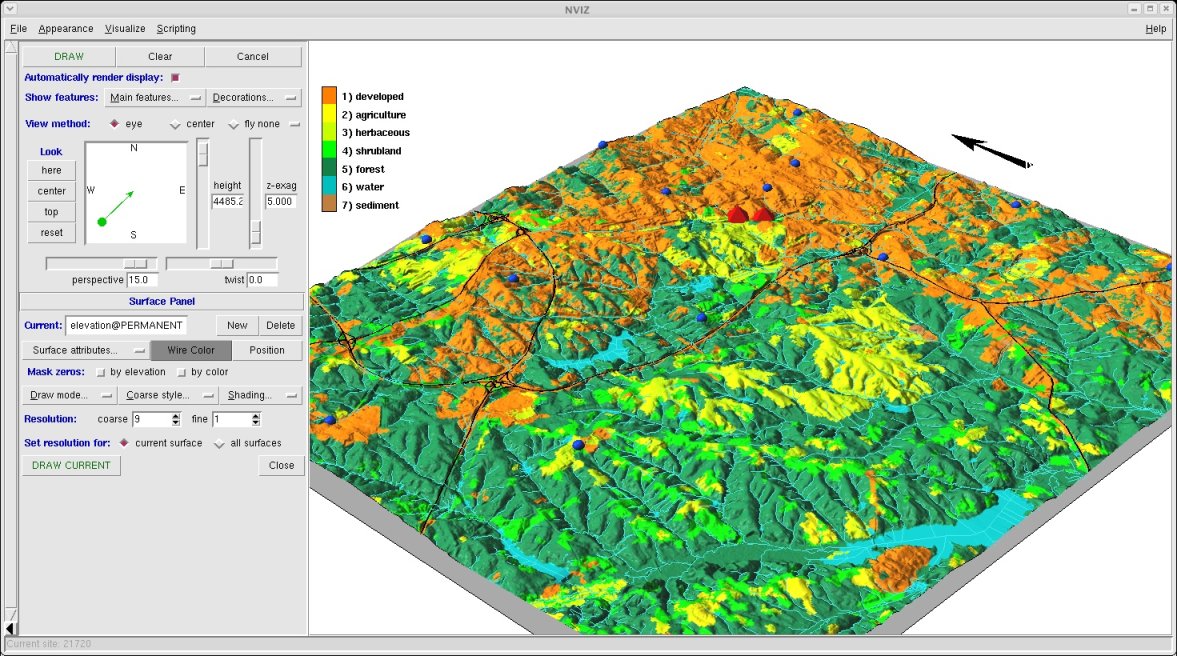 Visualizing raster and vector data in nviz | 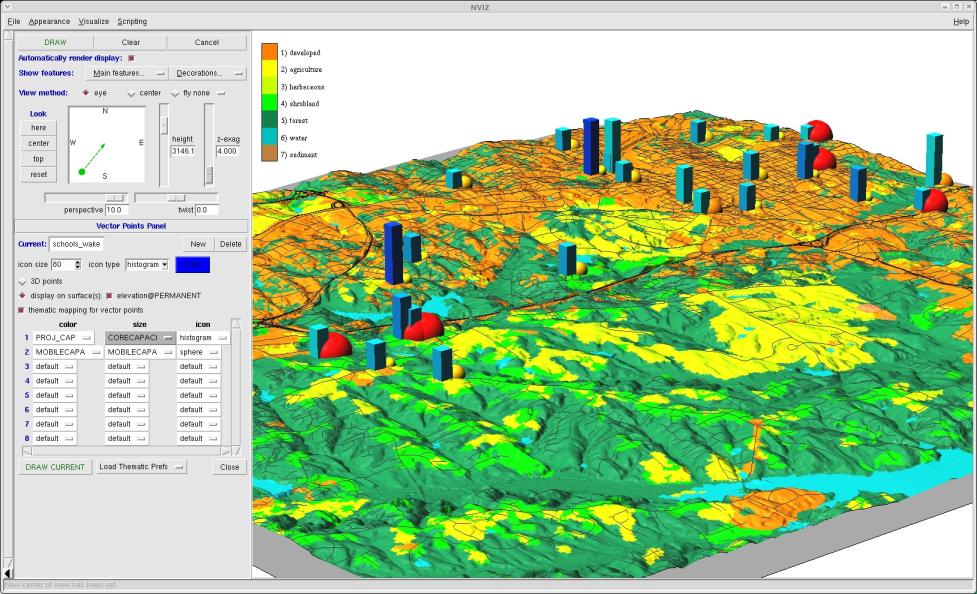 Visualizing points with multiple attributes |
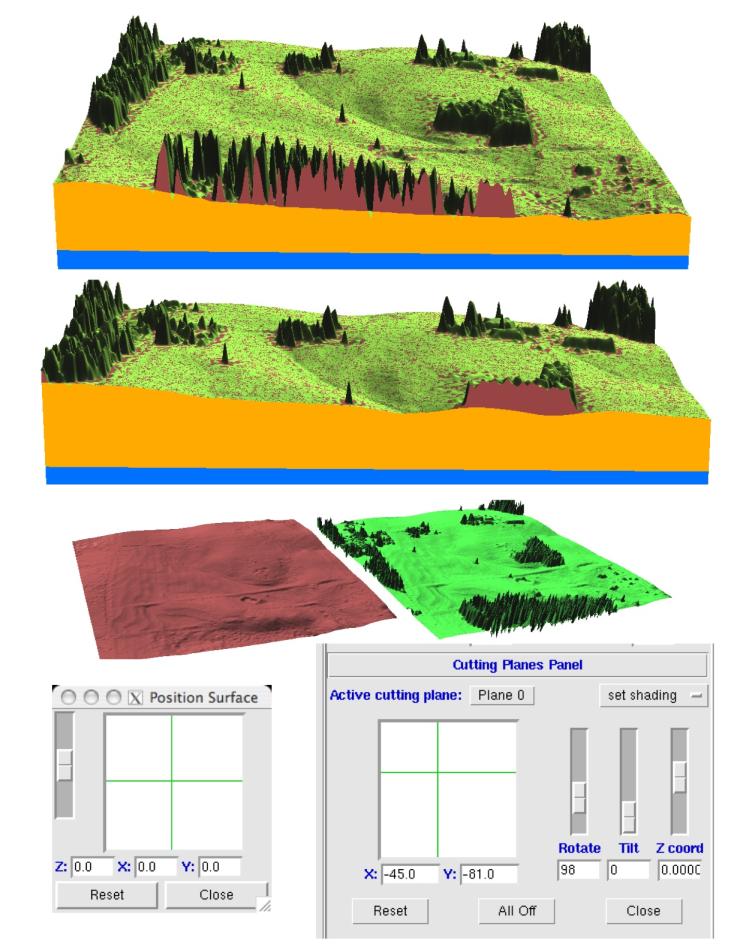 Visualizing multiple surfaces | Visualizing volumes |
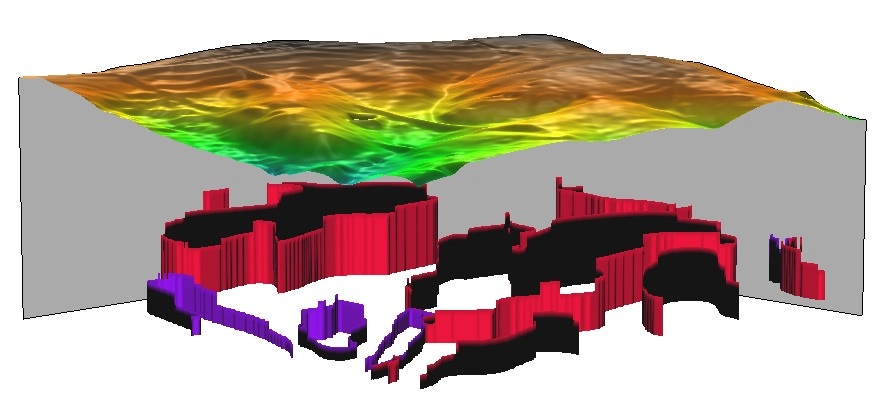 Visualizing volumes | 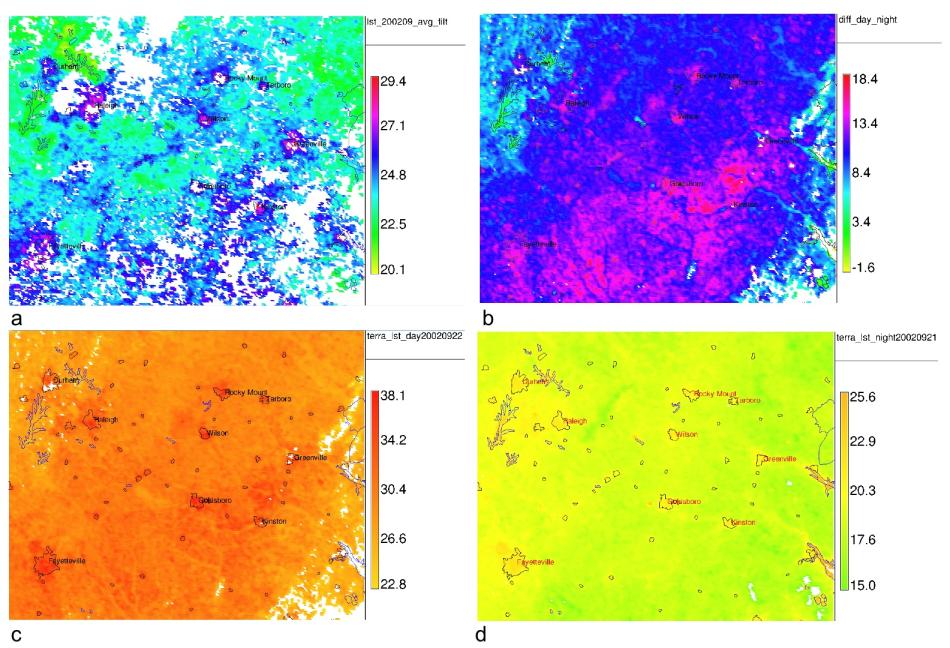 MODIS-derived Land surface temperatures (LST) |
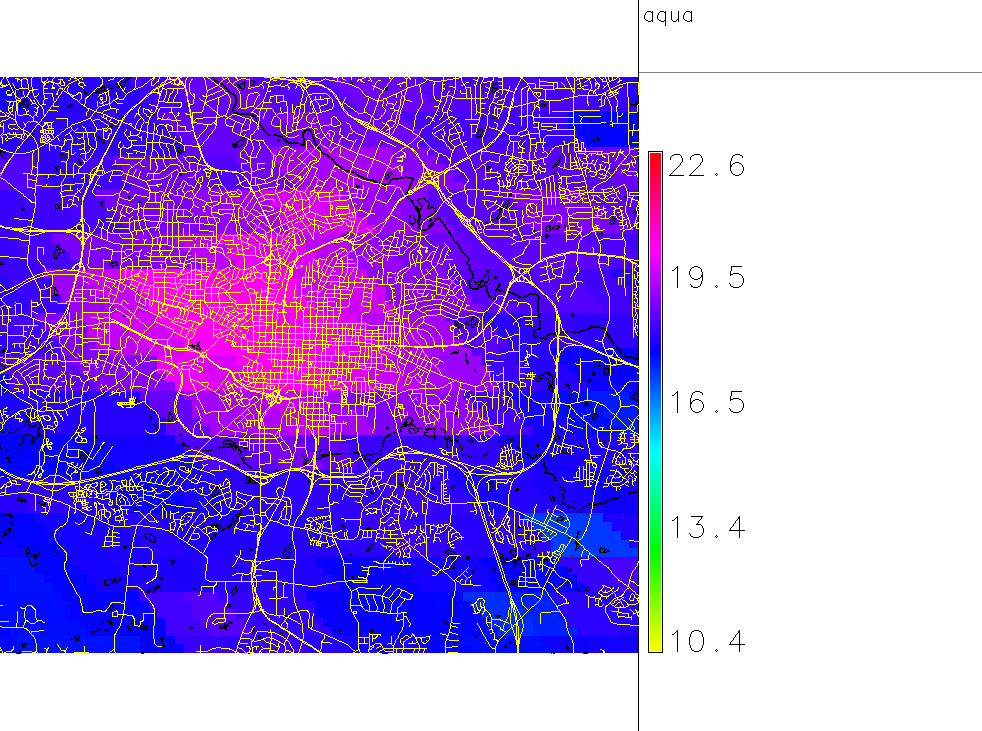 Raleigh land surface temperatures from MODIS (deg. Celsius, 25 Nov 2006, 13h30 local time) | 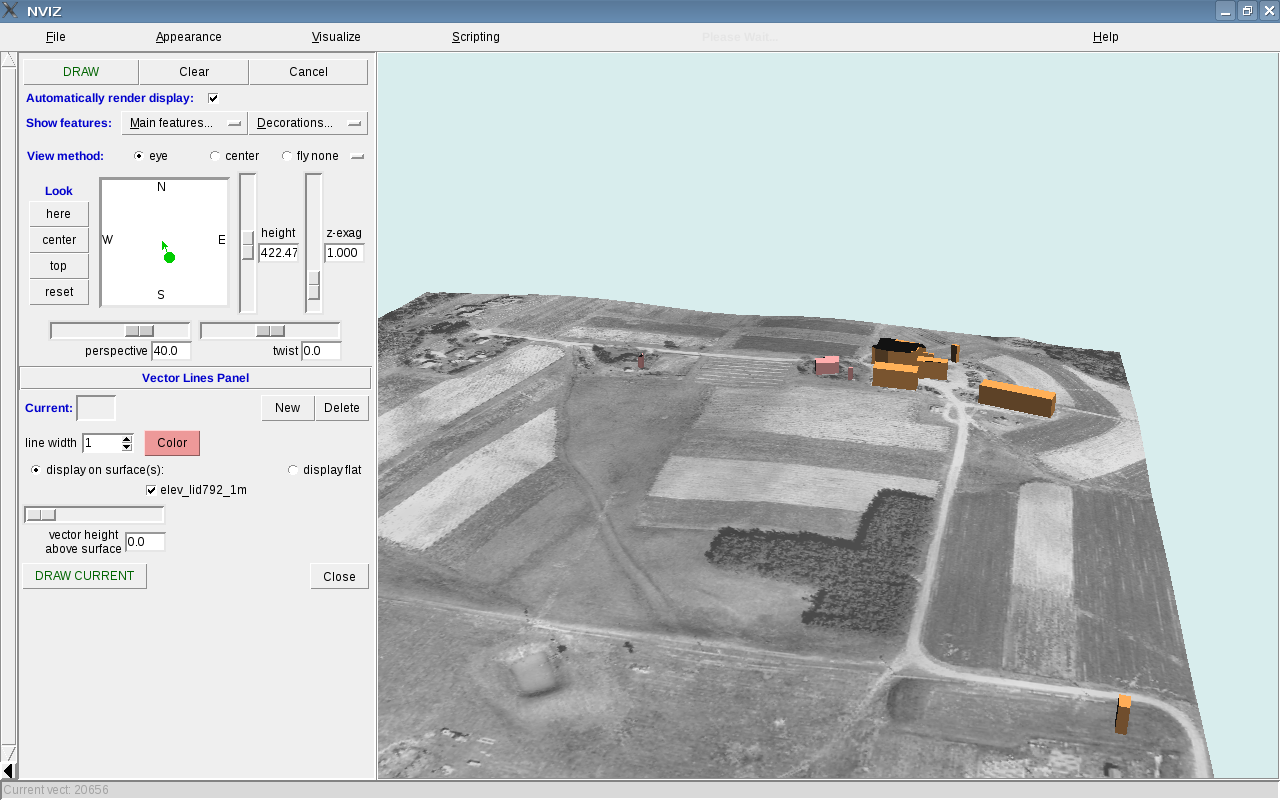 Commercial and residential buildings extruded from 2D DXF file |